Data tab
The Data tab is where every GeoPrior v3 run starts: you select (or import) a dataset, preview it, optionally edit/clean it, and make sure the core columns are correctly mapped to GeoPrior’s expected roles (time, lon/lat, target, groundwater level, etc.). The tab is organized as a left dataset library + dataset details, and a right preview / actions workspace. Internally it is implemented as a split view with a left panel and a right stacked view (empty-state vs loaded-state).
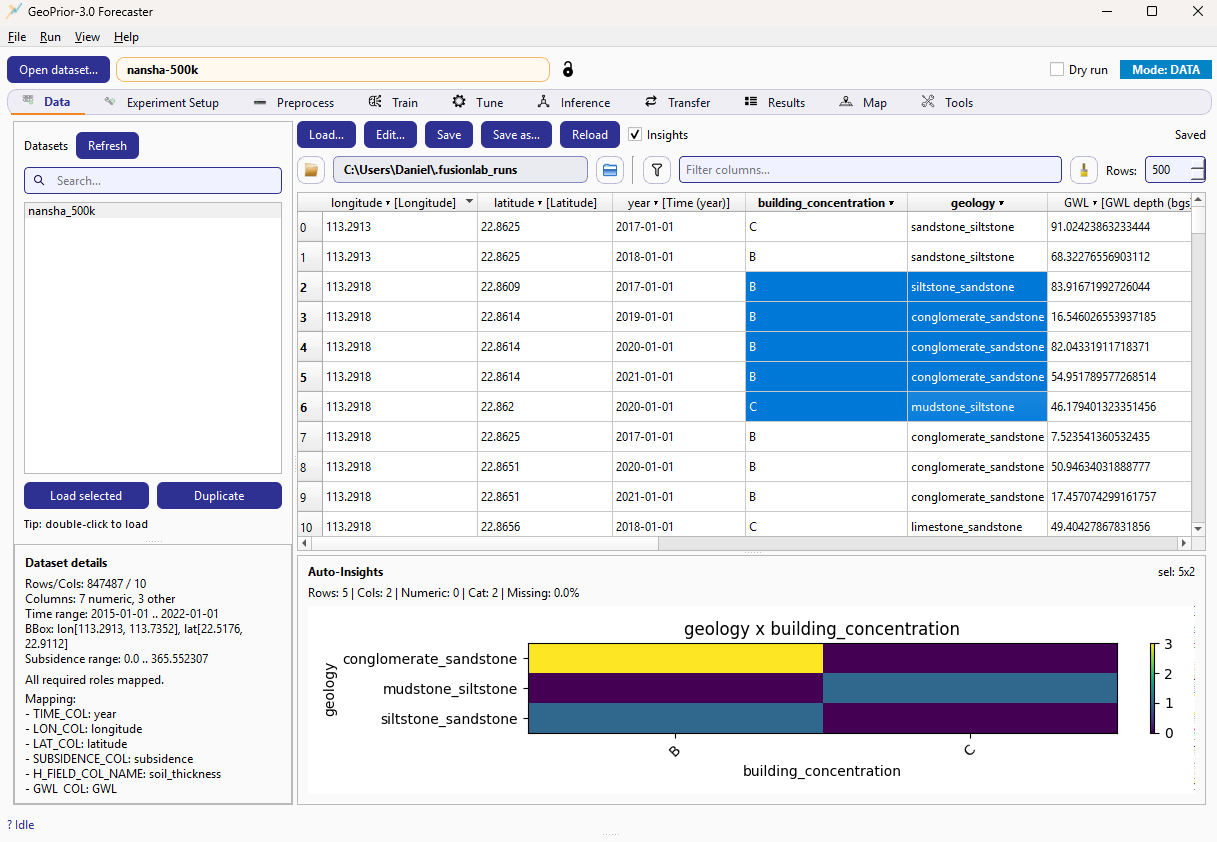
Data tab layout (example screenshot).
What you do here (and why it matters)
Most of the pipeline expects a consistent set of “core roles” to exist in the dataset (or to be explicitly mapped). The Data tab helps you:
load a dataset (from disk or from your dataset library),
quickly validate shape/range/coverage,
map columns to required roles (so the rest of the GUI can run),
optionally rename columns at save-time so future runs are consistent,
surface quick diagnostics via Auto-Insights (selection-aware plots).
When a dataset is loaded, the tab also emits signals so the rest of the application can sync (e.g., other tabs can populate combo-boxes with the detected columns).
Left side: Dataset library
The dataset library is a simple list of *.csv files under the current
datasets root. It includes:
Refresh: rescans the folder.
Search: filters dataset names by substring (case-insensitive).
Dataset list: sorted newest first when file timestamps are available.
Load selected: loads the highlighted dataset.
Duplicate: makes a copy of the selected dataset (useful for “edit without breaking the original” workflows).
You can also double-click a dataset in the list to load it.
This behavior is driven by refresh_library(), which scans the
datasets root, applies the search term filter, and sorts entries by
modification time when possible.
Note
The datasets root is typically the _datasets folder under your
results root. When you change the results root in the app, the
main window updates the Data tab to point at results_root/_datasets
and refreshes the list.:contentReference[oaicite:5]{index=5}
Left side (bottom): Dataset details
Below the library, the Dataset details panel appears when a dataset is loaded. It provides three key pieces of feedback:
Summary block A human-readable summary is generated from the active DataFrame (and optionally the current city / CSV path). This is where you see quick facts like rows/cols, time span, bounding box, and target ranges (exact contents depend on the summary helper).
Required roles status If required roles are missing, you’ll see a warning message like “Missing required roles: …”. When everything needed is mapped, it reports “All required roles mapped.”
Mapping summary The current column→role mapping is shown as a patch (key/value lines), suitable for feeding into the model configuration as feature overrides (e.g.,
TIME_COL,LON_COL,LAT_COL, …).
Right side: Empty-state vs loaded-state
Before a dataset is loaded, the right side shows an empty-state message (“No dataset loaded”) with a Load new dataset… button.
Once a dataset is loaded, the tab switches to the loaded-state view and enables the preview tools and details panels.
Right side (top): Actions + saved state
At the top of the loaded-state view is an action row with the common dataset operations:
Load…: open/browse and load a dataset.
Edit…: open the dataset editor workflow.
Save / Save as…: persist changes.
Reload: discard unsaved edits and reload from disk.
Insights checkbox: toggles the Auto-Insights pane.
These actions are emitted as requests (signals) and handled by the main window / controller layer (so I/O and dialogs stay centralized).
A small state label indicates whether the current dataset has unsaved
changes. The tab tracks a dirty flag and shows “Unsaved changes”
or “Saved” accordingly; the Save button is enabled only when the
dataset is dirty.:contentReference[oaicite:12]{index=12}
Right side: Results root field (run location)
Just below the action row you’ll see the results root path field.
This is the base directory where GeoPrior runs and outputs are stored.
The field is set by set_results_root() and also drives whether the
“open results root” action is enabled.
Tip
When the results root is long, the UI positions the cursor at the end of the path so the most informative part (the folder name) is visible immediately.
Right side: Preview table + column filtering
The central widget is a table preview of the loaded dataset.
Filter columns… filters the displayed columns by name substring. This does not delete columns; it only narrows what you see in the preview. The filter is applied when refreshing the preview model.
Rows: controls how many rows are shown in the preview (the tab displays
df.head(n)). This keeps the GUI responsive even for large datasets.
The preview uses a role-aware table model (RolePandasModel) so the
column headers can reflect role assignments (you’ll typically see a
dropdown marker and, when mapped, a role label like
longitude ▾ [Longitude]).
Column roles and mapping (the key GeoPrior contract)
GeoPrior needs specific semantic columns (time, lon/lat, subsidence
target, groundwater depth, etc.). In the Data tab, column→role mapping is
managed by a ColumnRoleMapper and is refreshed whenever a dataset is
loaded. The tab attempts an auto-assign step (best-effort), then
emits a feature-overrides patch for the rest of the application to
consume.
How to change a role mapping
From the column header, open the role menu and choose the appropriate role. You can also set the mapping to None to unassign a role. After a change, the tab:
updates the mapping,
emits the overrides patch,
refreshes the preview table,
refreshes the dataset details panel (so the required-role status is immediately updated).
How mappings affect saving
When saving, the tab can apply a rename map derived from your role
assignments (so the dataset on disk can be normalized to expected column
names). This is done in dataframe_for_save() (returns either the raw
DataFrame or a renamed copy).
Auto-Insights (bottom pane)
When Insights is enabled, the tab shows a bottom pane that produces quick plots/statistics based on the current preview slice and (when supported) your current selection in the table. Internally, the insights controller uses the same preview data the table is showing. The pane can be fully hidden/shown by resizing a splitter: checked → visible; unchecked → collapsed.
In practice, you use Auto-Insights to quickly spot:
missingness patterns,
obvious categorical vs numeric issues,
suspicious value ranges,
whether important features co-vary in unexpected ways (e.g., a quick cross-tab heatmap for two categorical fields, as shown in the example screenshot).
Note
Auto-Insights is designed for fast feedback, not full EDA. For deeper validation, use the Tools tab (dataset explorer / manifest validators) once those tools are available in your build.